Cloud & DevOpsBy Abdul Rahman12 Aug 20262 min read
Observability with OpenTelemetry: Logs, Metrics and Traces
Monitoring tells you something is wrong; observability tells you why. How OpenTelemetry unifies logs, metrics and traces, and how to instrument a Node.js service in minutes.

When a user reports "the app is slow", monitoring can confirm the symptom: latency is up. Observability lets you find the cause — which service, which endpoint, which database query, for which customer. As systems spread across APIs, queues and third-party services, observability has become a core engineering skill.
OpenTelemetry (OTel) is the open, vendor-neutral standard for producing that data, backed by the Cloud Native Computing Foundation and supported by virtually every monitoring vendor.
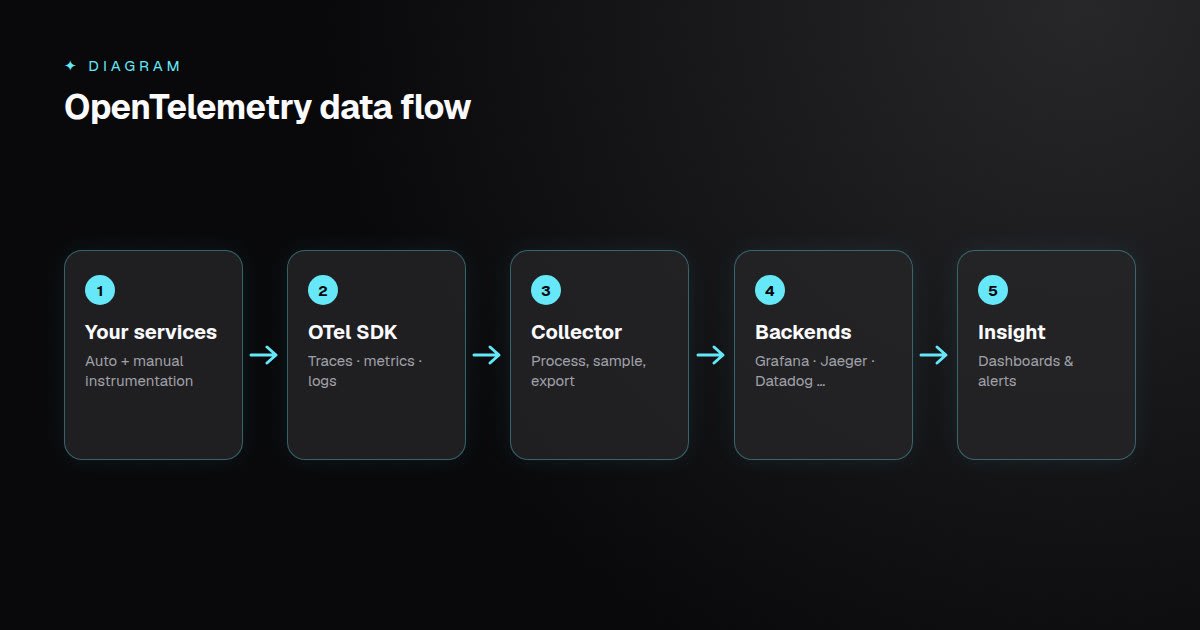 Instrument once with an open standard; send data to any backend you choose.
The Three Signals
- Logs — timestamped records of discrete events. Best for detailed context about a specific failure.
- Metrics — numeric measurements over time: request rate, error rate, latency percentiles, queue depth. Best for dashboards and alerts.
- Traces — the path of a single request across services, broken into timed spans. Best for finding where time is spent.
Their real power comes from correlation: a latency alert (metric) links to slow traces, and each trace links to the logs written during that request.
Instrumenting a Node.js Service
OpenTelemetry's auto-instrumentation captures HTTP, database and framework calls with almost no code:
// instrumentation.ts — load before the rest of the app
import { NodeSDK } from "@opentelemetry/sdk-node";
import { getNodeAutoInstrumentations } from "@opentelemetry/auto-instrumentations-node";
import { OTLPTraceExporter } from "@opentelemetry/exporter-trace-otlp-http";

const sdk = new NodeSDK({
  serviceName: "school-api",
  traceExporter: new OTLPTraceExporter({ url: process.env.OTEL_EXPORTER_OTLP_ENDPOINT }),
  instrumentations: [getNodeAutoInstrumentations()],
});

sdk.start();
Add manual spans and attributes around important business operations — for example tagging each span with a tenant.id in a multi-tenant SaaS, so you can see whether a problem affects one customer or all of them.
The Collector
The OpenTelemetry Collector receives telemetry from your services, then processes and exports it: batching, sampling, removing sensitive fields, and sending data to one or more backends. Because the Collector sits in the middle, you can change vendors without touching application code.
What to Measure
A practical starting point for every service is the RED method:
- Rate — requests per second,
- Errors — failed requests,
- Duration — latency percentiles (p50, p95, p99).
Alert on symptoms users feel (error rate, p95 latency against a service-level objective), not on every internal metric.
Practical Tips
- Use structured logs (JSON) and include the trace ID in each log line.
- Sample traces in high-traffic systems, but keep all error traces.
- Never log secrets or personal data; scrub them in the Collector.
- Define SLOs — for example, 99.5% of requests under 500 ms — and alert on error-budget burn.
Key Takeaways
- Logs, metrics and traces answer different questions; correlate them.
- OpenTelemetry is the vendor-neutral standard for instrumentation.
- Auto-instrumentation gets you most of the way; add business attributes manually.
- Alert on user-facing symptoms and SLOs, and keep sensitive data out of telemetry.